Selected results of the GRECO project
Results of PV modeling
In section PV Modeling the models used to generate feed-in time series for SI, CPV and PSI technologies are presented. This section shows selected results of the calculated time series and discusses model assumptions.
The generated hourly time series over one year are normalized by the peak power of each module. Figure Normalized time series shows an exemplary time series for all three technologies in the year 2014 in Madrid.
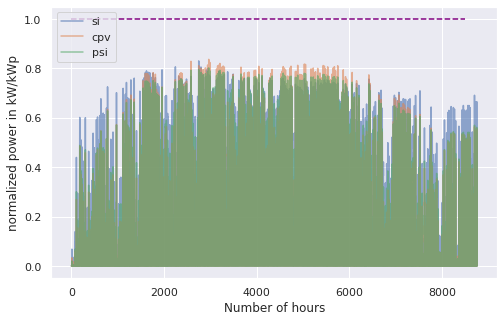
Normalized time series for Madrid, Spain in 2014.
Figure Daily Profiles shows the daily profiles of all three technologies. It demonstrates how the CPV technology has a more narrow profile, because it highly depends on the DNI. Further, the profile of PSI exceeds the SI profile in the middle of the day. It can be seen nicely how the profiles are shifted on the east and west facade due to the solar position. The profiles are normalized with their maximum value in order to compare them conveniently.
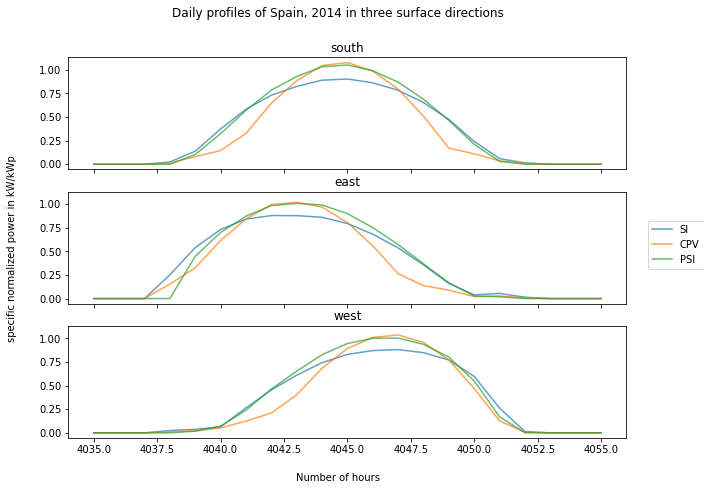
Daily profiles (normalized with maximum value) of SI, PSI and CPV for south, east and west orientation, Spain in 2014.
Energy yield
The size and efficiency of the three modules used age given in table1.
Technology |
Module Size (m²) |
Efficiency (%) |
|---|---|---|
SI |
1.6434 |
17 |
CPV |
0.1 |
32 |
PSI |
1.219 |
24.5 |
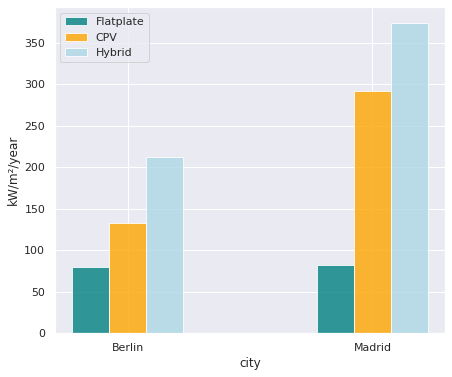
Figure energy yield shows the yearly energy yield per kWp on the left-hand side and the yearly energy yield per m² on the right-hand side. The plot shows that the production per kWp is the highest for SI. This is due to a high performance ratio of SI. The lower performance ratio of Hybrid CPV results in a lower production per kWp. Nevertheless, when looking at the production per m², the Hybrid CPV technology as well as the PSI technology perform better than SI, due to it’s higher efficiency (Wp per m²). Overall, as expected, the yield in Berlin is lower than in Madrid but also the margin between the technologies decreases in Berlin. This outcome is due to a lower direct normal irradiance (DNI) in Berlin which causes a decrease in the yield of the Hybrid CPV technology.
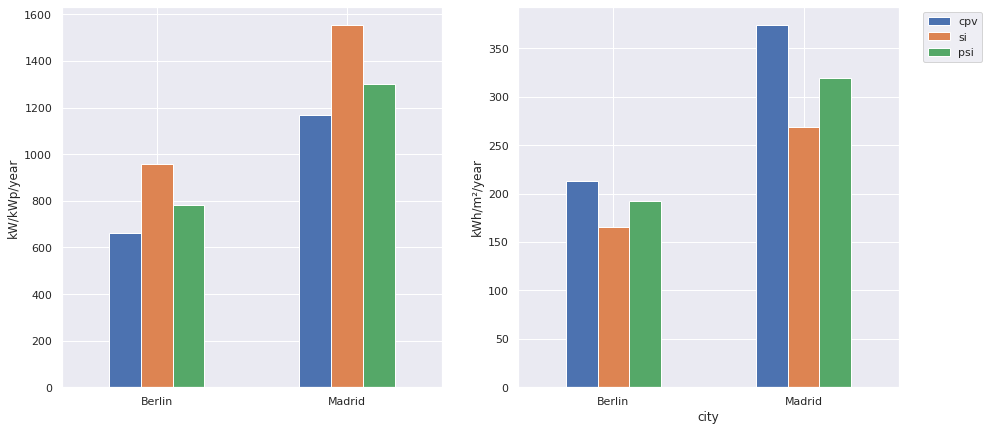
Energy yield per kWp (left) and per m² (right) for Berlin and Madrid in 2014.
Hybrid CPV
Figure CPV - Flatplate profile shows the daily production of a single CPV and Flatplate panel for Spain in 2014. The figure shows how the flatplate produces only in the morning and the evening, because it is restricted to a solar angle > 60°. The CPV component has a more narrow peak in the middle of the day, when the DNI has its maximum.
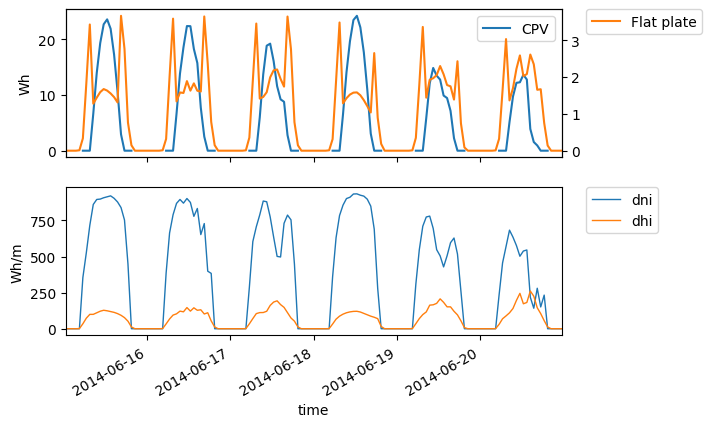
Electricity production of Flatplate and CPV component and irradiance (DHI, DHI) in Madrid, Spain in 2014.
Figure Hybrid CPV illustrates the energy yield for the different components of the Hybrid CPV technology. The Flatplate component collects diffuse horizontal irradiance (DHI) while the CPV components only collects direct normal irradiance (DNI). The Hybrid module adds up both power outputs of the Flatplate and the CPV part. For more information about the modeling of Hybrid CPV see PV Modeling.
Yearly energy yield of the Hybrid CPV and its components per m² for Berlin and Madrid in 2014.